There is a frequent and definitive pattern in price movement, whereby price will steadily drift lower, then accelerate before bottoming out. Similarly, price will often steadily rise, then accelerate into a climax top.
No matter what trading strategy is being used, or what type of market is being traded, it is useful to distinguish between slow and steady versus more extreme, accelerated price movements. These accelerated price movements coincide with exceptional market conditions, when a trader should be watchful and prepared. Accelerated price movements can also be incorporated into a trading strategy, such as taking profits in a climax top or entering new positions at overbought or oversold price levels.
A Volatility Based Momentum Oscillator
Defining a technical indicator which delineates between steady and accelerated price movements is straightforward:
- A short-term exponential moving average is used to plot the direction of price movement. A 9 period exponential moving average is recommended.
- For the closing, high and low prices, a difference is calculated versus the exponential moving average. These values will be positive when price is above the moving average, negative otherwise.
- Finally, these difference values are normalized using the historical volatility of the underlying trading instrument (e.g, stock, currency pair, index). For this purpose, the ATR technical indicator is used. A volatility measurement should capture the historical volatility, but also be short-term enough to coincide with the recent volatility; to this end, an ATR calculation with 66 periods is recommended.
Based upon the definition above, a technical indicator can be created in charting software. For example, using the TradingView website, a custom volatility based momentum oscillator (VBMO) can be created with scripting code like the following:
movingAvgPeriod = 9
atrPeriod = 66
moveAvg = ema(close,movingAvgPeriod)
normalizationATR = atr(atrPeriod)
closeVsMA = close-moveAvg
volatilityBasedCloseVsMA = closeVsMA/normalizationATR
lowVsMA = low-moveAvg
volatilityBasedLowVsMA = lowVsMA/normalizationATR
highVsMA = high-moveAvg
volatilityBasedHighVsMA = highVsMA/normalizationATR
plot(volatilityBasedCloseVsMA,color = blue,title=“Close vs MA”)
plot(volatilityBasedLowVsMA,color=gray,title=“Low vs MA”)
plot(volatilityBasedHighVsMA,color=gray,title=“High vs MA”)
The VBMO indicator has also been published on TraderView, and is available for use with your own charts.
Below is an example chart with the VBMO Indicator plotted below a candlestick chart. In this example, the Euro / U.S. Dollar currency pair is shown on a 4 hour timeframe.
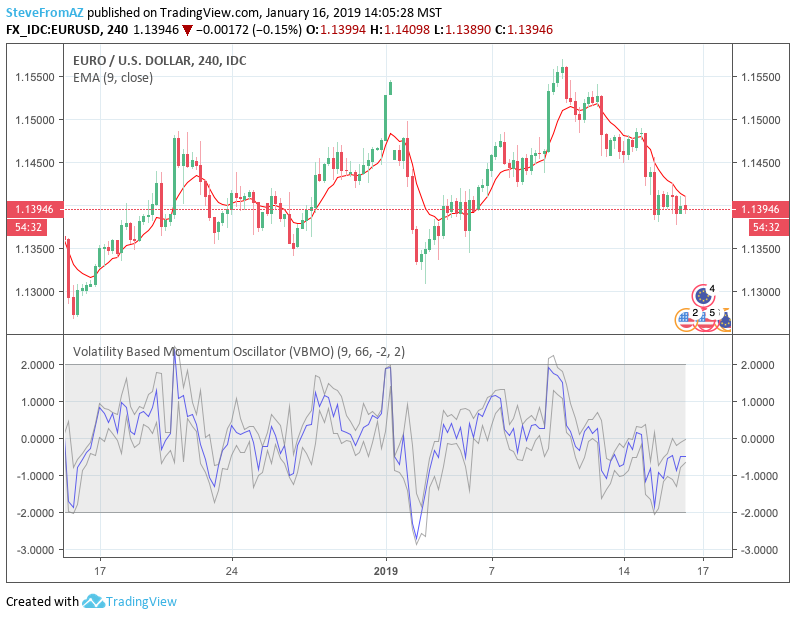
As shown in the example above, most of the time, VBMO will fall between -2 and 2. Indicator values above 2 or below -2 represent overbought and oversold conditions respectively. In extreme market conditions, however, values can go well above 2 or well below -2.
The unit for the VBMO indicator is multiples of volatility (MoV). Indicator values increase or decrease as price diverges or converges with the exponential moving average. Notably, since indicator values are normalized using the historical volatility of the underlying trading instrument, VBMO has the same unit and scale for any instrument or timeframe.
To the extent VBMO is based upon convergences and divergences with a moving average, the indicator is somewhat similar to the Moving Average Convergence Divergence (MACD) indicator. However, while MACD tracks the convergence and divergence of 2 moving averages, VBMO tracks the convergence and divergence of price itself with respect to a single moving average. VBMO also differs from MACD, since the indicator values are normalized using the trading instrument’s volatility.
Applicability of VBMO
Similar to other technical indicators, VBMO is not intended to be used in isolation. The intent is for this indicator to be incorporated into a broader trading strategy and plan, interpreted in the context of current market conditions (e.g. range-bound vs trending markets), and combined with other analysis and technical indicators to confirm trading signals. In this regard, some examples where VBMO can be applied include the following:
- Mean reversion strategies — Values above 2 or below -2 represent overbought and oversold conditions. Combined with risk management, VBMO can form the basis of a mean reversion strategy.
- Selling into strength — After drifting higher, when price accelerates considerably into a climax top, many traders use this as an opportunity to sell or scale back their position.
- Capitulation — After a steady sell-off, downward price movement can trigger a wave of further selling and an acceleration of downward price movement. For certain trading strategies, this can in itself be a good entry point.
- Potential conditions for a market crash — In most cases, VBMO will oscillate between 2 and -2. However, in exceptional market conditions, markets can crash from already oversold levels.
- Divergences — Similar to other technical indicators, VBMO will sometimes diverge with respect to price itself. For example, price may continue higher, while VBMO makes lower highs, signaling a reversal is possible.
- Multiple timeframes and instruments — Since VBMO’s values are normalized using historical volatility, the same ‘multiples of volatility’ units are used for any trading instrument or timeframe. A trader can therefore interpret values from VBMO in a similar manner for different timeframes and instruments.
Examples
The following examples show how VBMO can be used with different trading instruments and timeframes, and illustrates how the indicator can be interpreted in different market conditions or combined with other types of analyses.
Tesla (TSLA) trades within a range: Since early 2018, Tesla has basically traded in a range between $260 and $380. This has presented several opportunities for long and short trades within this range. In this case, the VBMO indicator helps to identify possible turning points.
 undefined
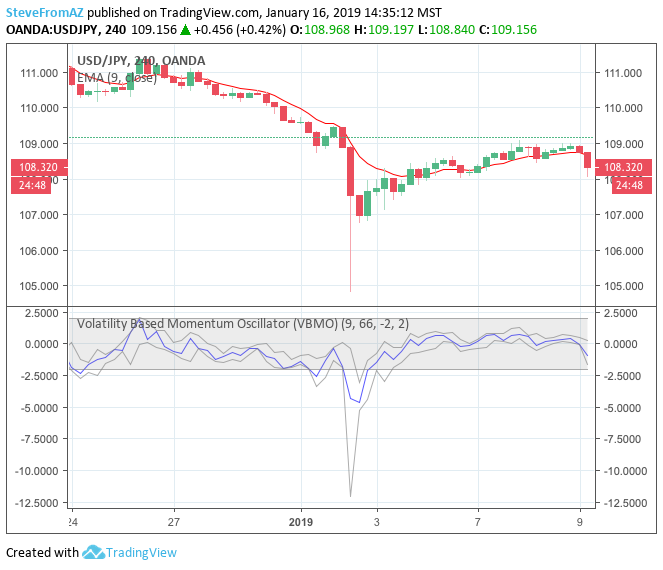
Forex flash crash: In early 2019, the USDJPY currency pair and similar pairs underwent a steep but temporary price drop, or flash crash. This resulted in extreme values for the VBMO indicator. Even though VBMO values will typically oscillate between -2 and 2, extreme values are also possible.
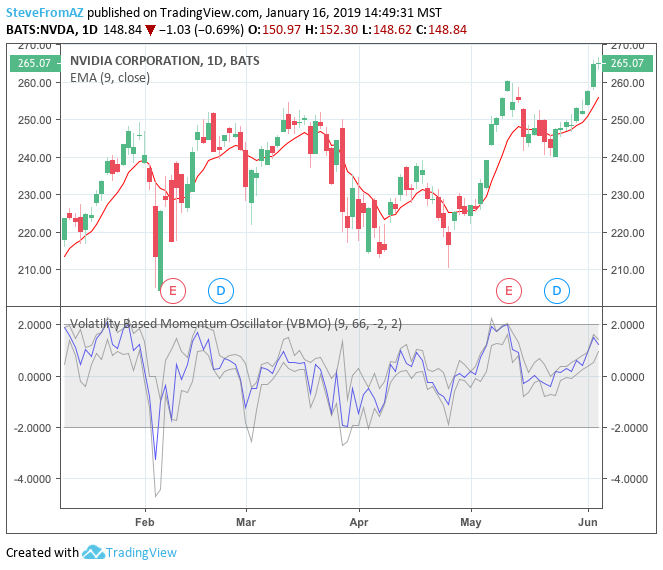
Nvidia (NVDA) hits a climax top right before earnings: Back in May 2018, Nvidia’s stock price moved higher going into earnings. In the daily chart below, VBMO signals an overbought level just before the earnings announcement. Depending on one’s trading strategy and risk management, this would have been a good time to sell into strength and take some profits.
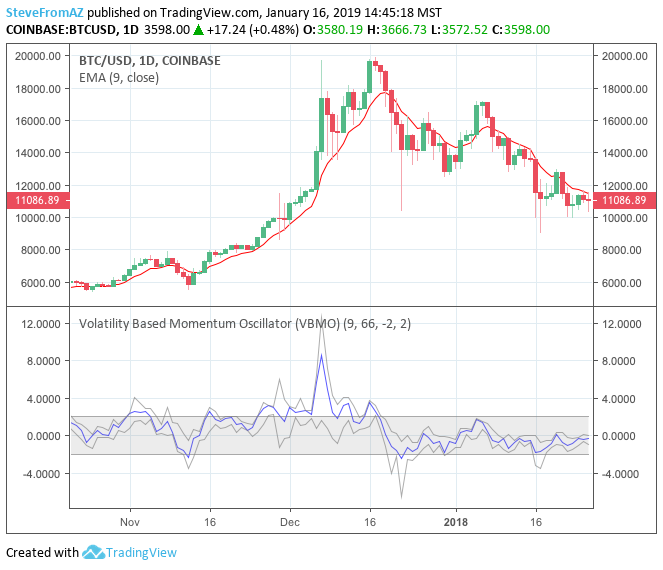
Bitcoin (BTC/USD) goes parabolic: Up until December 2017, the price of Bitcoin, denominated in USD, had been rising very quickly. The initial price movement resulted in an extreme VBMO value over 12. However, after this initial parabolic move, there was a divergence, since price continued higher but VBMO didn’t match previous levels. Based upon this divergence, an astute trader would have been prepared for a possible reversal.
Summary
A volatility based momentum oscillator (VBMO) is calculated using a short-term moving average, the distance of price from this moving average, and the trading instrument’s historical volatility. Even though VBMO’s calculation is relatively simple, the resulting values can help traders identify, analyze and act upon many scenarios, such as climax tops, reversals, and capitulation. Moreover, since the units and scale for VBMO are always the same, the indicator can be used in a consistent manner across multiple timeframes and instruments.